Data Driven @ Stanford
Stanford University ,
REVS Program
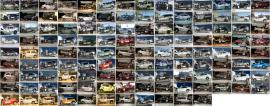
Multimedia collection of vehicle data collected as part of the Revs Program Vehicle Dynamics Database from the 2013 Targa Sixty-Six at Palm Beach International Raceway; 2013 Monterey Motorsports Reunion and 2014 Targa Sixty-six.
Data Set Categories:
Data Set Categories:
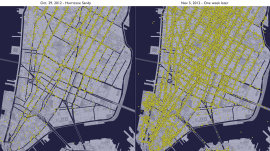
This dataset includes more than 850,000,000 New York cab rides spanning from 2008 to 2013. The data includes details such as where each taxi picked up and dropped off their customers, how long the ride lasted, and how much the cabbie was tipped.
Data Set Categories:
Federal Highway Administration
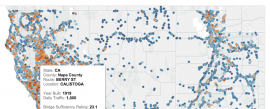
This Federal Highway Administration database lists structural evaluations and codes for all bridges in the U.S. For the most recent year, 2013, the data includes only highway bridges*. In previous years, it includes bridges on highways, railroads, pedestrian-bicycle bridges, overpasses and those designated as historically significant
Data Set Categories:
U.S. Department of Energy ,
Energy Efficency and Renewable Energy
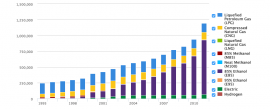
Find maps and charts showing transportation data and trends relatedto alternative fuels and vehicles.
Data Set Categories:
Texas A University ,
Transportation Institute
A nationwide study with congestion metrics for nearly 500 American populated areas.
Data Set Categories:
American Public Transportation Association
A data portal with a compilation of industry and government-sourced statistics, inluding public transportation ridership
Data Set Categories:
Bureau of Labor Statistics
Labor statistics (employment, earnings and hours) provided in theautomotive industry, including industries associated with theproduction, wholesaling, retailing, and maintenance of motor vehicles. The BLS site also includes interactive graphs.
Data Set Categories:
U.S. Department of Transportation ,
Bureau of Transportation Statistics
National border-crossing statistics from 1995-2014. Downloadable in CSV form
Data Set Categories:
U.S. Department of Transportation
This API makes available the safety performance data of DOT registeredbus companies.
Data Set Categories:
Center for the Management of Information for Safe and Sustainable Transportation
Annual compilations of fatal traffic accidents involving buses. The records are extracted from the Fatality Analysis Reporting System, and contain virtually all the variables from the FARS files at the Accident, Vehicle, and Person data files. In addition, the BIFA data includes information about the vehicle, company, and driver, as collected through a survey process.Zip files are provided for 1999 to 2010.
Data Set Categories:
Bay Area Census
This census uses American Community Survey data to highlight transportationtrends in the SF Bay Area.
Data Set Categories:
California Department of Transportation
Annual and monthly traffic counts/volume for all CA state highways.
Data Set Categories:
Chicago Department of Transportation
An approximation to the actual number of vehicles passing through agiven location on an average weekday. Sample counts are taken along larger streetsto get an estimate of traffic on half-mile or one-mile street segments. 2006 data.Data collected every 10 years.
Data Set Categories:
Chicago Transit Authority
Estimates traffic congestion in Chicago in real-time by continuouslymonitoring and analyzing GPS traces received from Chicago Transit Authority (CTA)buses every 10 minutes. Congestion is represented by speed in miles per hour.
Data Set Categories:
National Highway Traffic Safety Administration
This API for the NHTSA's Child Safety Seat Inspection Station Locator. Get data by zip code, state, or geo location.
Data Set Categories:
Census Bureau
A worker’s travel from home to work. Data are available from the American Community Survey (ACS), Decennial Census (2000 and prior), Survey of Income and Program Participation (SIPP), and the American Housing Survey (AHS).
Data Set Categories:
New York ,
Department of Motor Vehicles
Driver License, Permit, and Non-Driver Identification Cards Issued by County, Age, and Gender, beginning 2009
Data Set Categories:
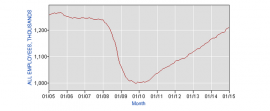
Edmunds
Edmunds.com provides data on auto sales, monthly fuel costs, marketshare, recalls, complaints, and consumer information.
Data Set Categories:
U.S. Department of Energy ,
U.S. EPA National Vehicle and Fuel Emissions Laboratory
Contains data files and reports of fuel economy evaluations, in CSV and XML files. Fuel economy data are the result of vehicle testing done by the EPA in Ann Arbor, Michigan, and by vehicle manufacturers with oversight by EPA.
Data Set Categories:
EPA
CSV data files containing descriptions of vehicles used for fuel economytesting.
Data Set Categories:
Federal Highway Administration ,
Office of Highway Policy Information
The Highway Statistics Series consists of annual reports containing analyzed statistical informationon motor fuel, motor vehicle registrations, driver licenses, highway user taxation,highway mileage, travel, and highway finance.
Data Set Categories:
Federal Highway Administration
A report on the physical conditions, operational performances, andfinancing mechanisms of highways, bridges, and transit systems, based on dataacquired from the American Recovery and Reinvestment Act of 2009
Data Set Categories:
New York City ,
Department of Motor Vehicles
Data set containing information on the facilities licensed by DMV in accordance with Vehicle and Traffic Law.
Data Set Categories:
Massachusetts ,
Department of Transportation
Anonymized information about the age, model, estimated mileage, fuel, efficiency, and zip code of passenger and commercial vehicles registered in the state from 2008 to 2011
Data Set Categories:
New York ,
Department of Motor Vehicles
Attributes about each crash case which may consist of a single or multiple reports occurring during the year.
Data Set Categories:
New York ,
Department of Motor Vehicles
Attributes about each individual involved in a crash as reported to NYS DMV
Data Set Categories:
New York ,
Department of Motor Vehicles
Attributes about each vehicle involved in a crash as reported to NYS DMV
Data Set Categories:
New York ,
Department of Motor Vehicles
Attributes about each violation citation issued at the scene of the motor vehicle crash reported to NYS DMV
Data Set Categories:
NADA
Annual financial report of new car dealerships in the U.S. Available in PDF form.
Data Set Categories: